
Could the STI be one of the best diversifiers hiding in plain sight?
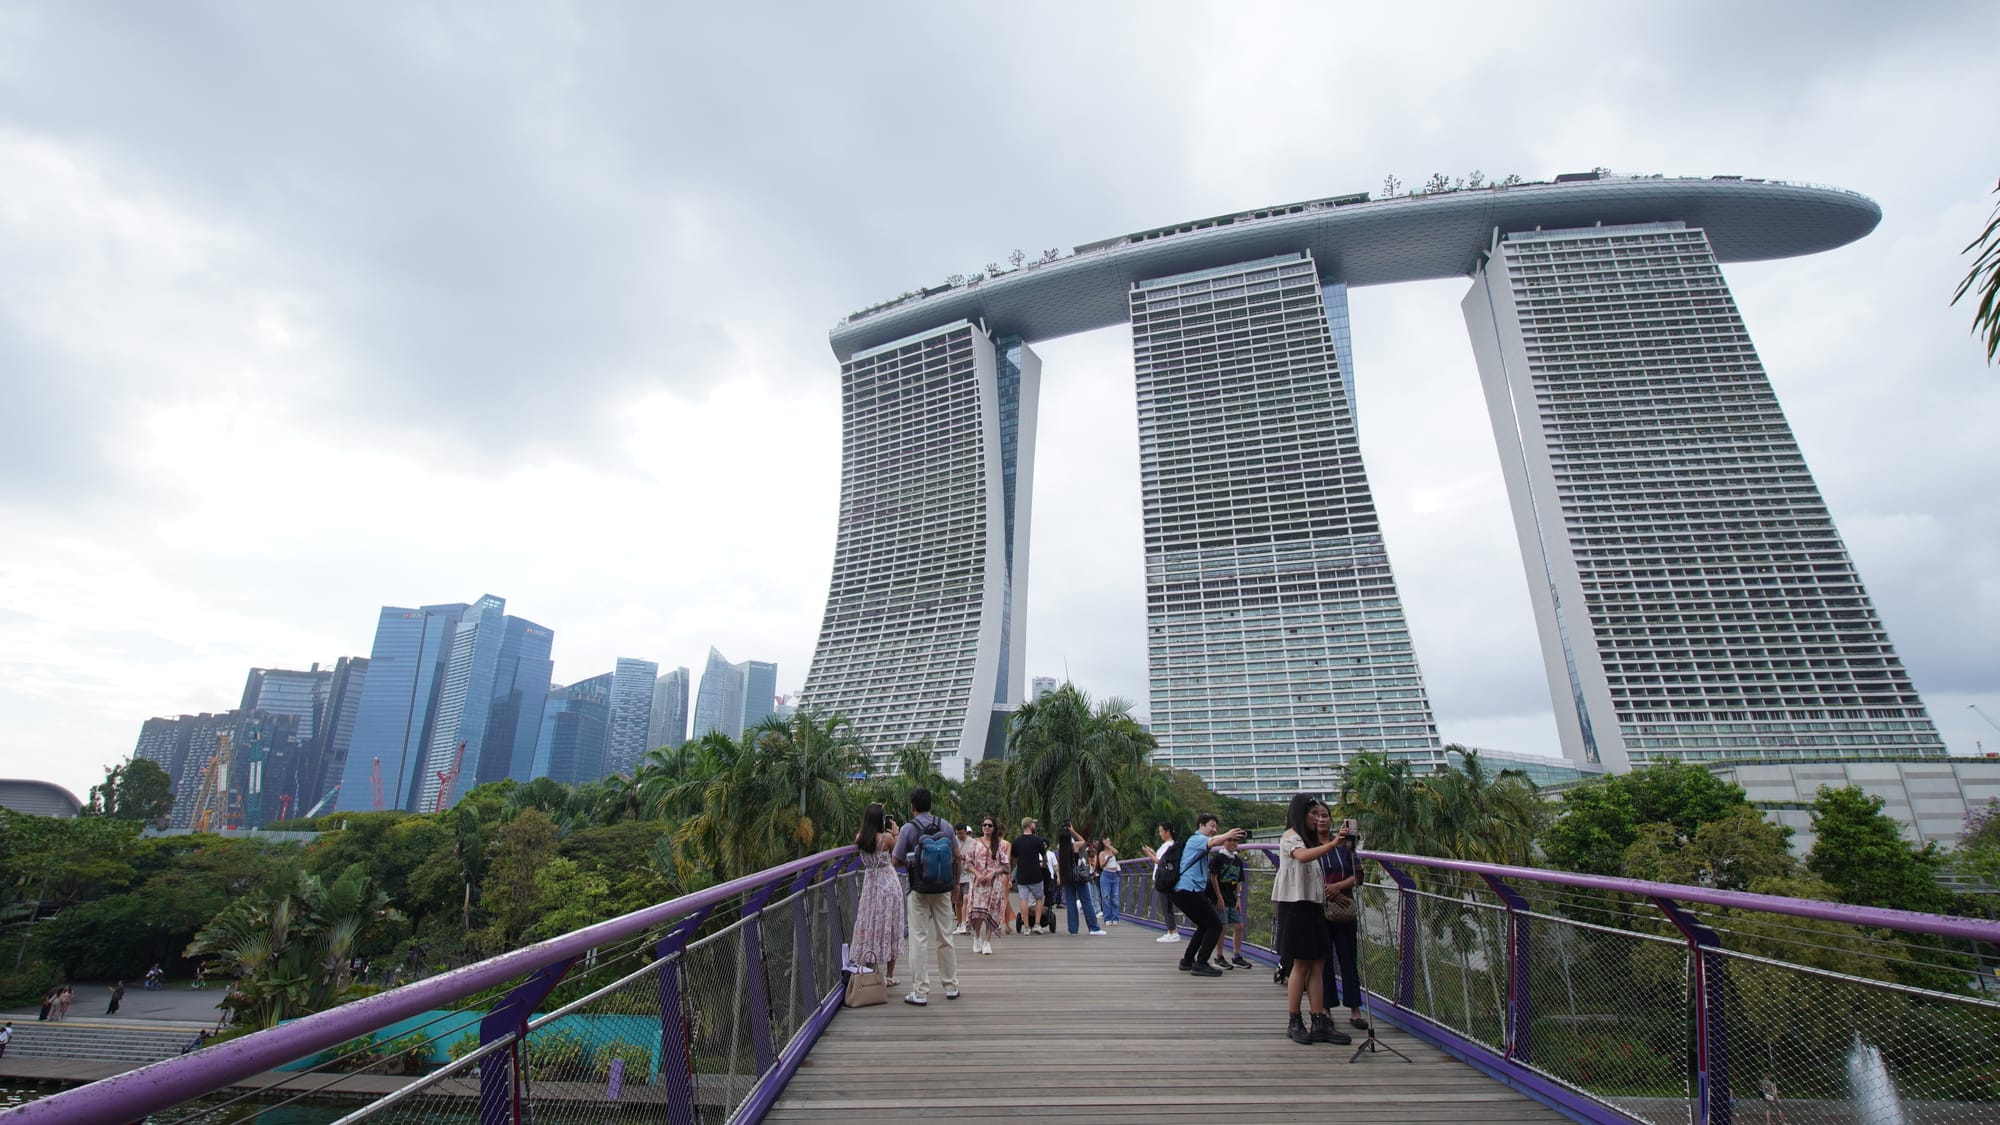
Did you know the Singapore stock market doesn’t move nearly as closely with the S&P 500 as most people think
Historically, for every 1% move in the S&P 500, the STI has only moved about 0.29% on average.
I came across this article , where the correlation between Singapore various market indexes range between 0.4 - 0.7, which is a little surprising given how connected we are to the world.
Since the indexes the author used were not the usual ones people invest in, or I invest in. I wanted to know how my own investments were actually correlated.
I downloaded 20 years of monthly data and ran a simple regression between the STI and the S&P 500 using Gemini.
Gemini generously included price correlation, please ignore that column
Correlation by Historical Timeframes
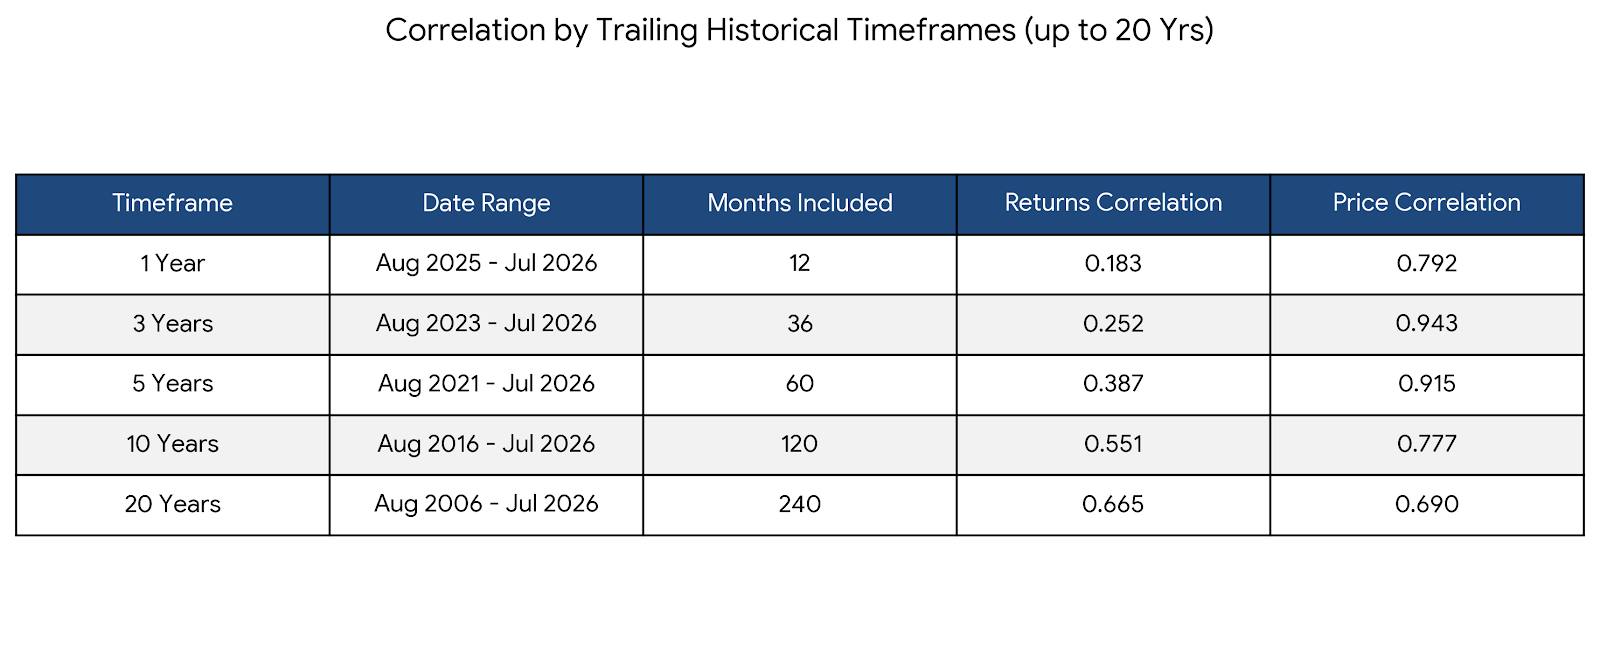
It's quite interesting how little STI & SPY500 returns are correlated.
Before trusting the results, I checked the usual assumptions behind the regression.
Test Output
1. Return data is stationary
2. No serial correlation on monthly time frame
3. Returns are highly heteroskedastic
Nerdy stuff, let's just say we can trust the output 😄
Singapore stock market returns are indeed not highly correlated with U.S. stock market returns
If we refer back to the correlation, the 10 year correlation is very different from 3 years. What happened?
It made me wonder if relationship had changed over time. To explore that, I split the data by U.S. presidential terms and re-ran the regression
By U.S. Presidential Term (4-Year Intervals)
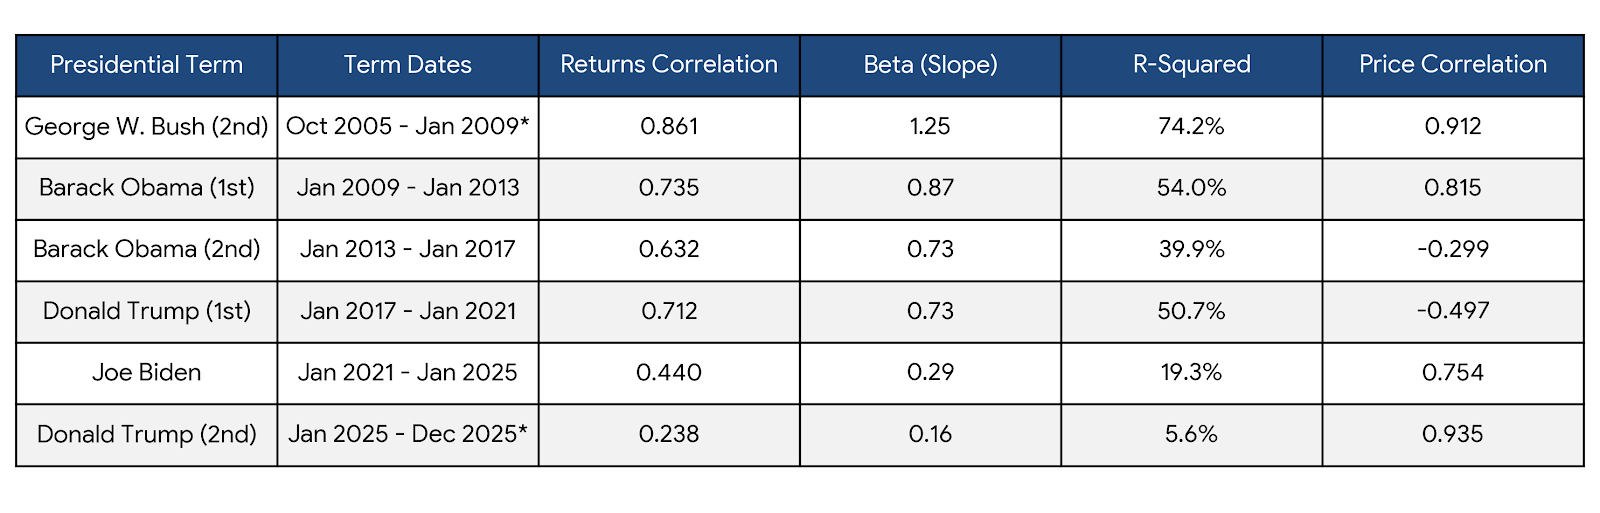
Coincidentally, the decline in correlation also spans several U.S. administrations. Whether this reflects changing trade policies or other structural factors, that is beyond the scope of today. But it’s an interesting observation.
I think there can be many reasons for this but this poor correlation might be a very useful information for Singapore investors.
Annualised Price Return S&P500 vs STI
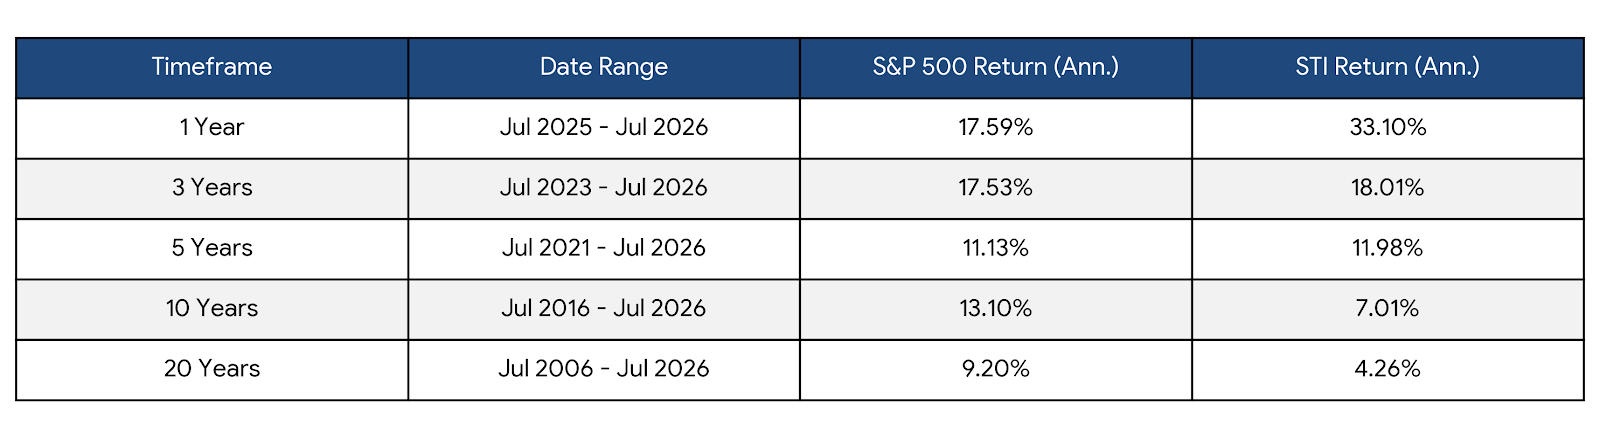
If we also compare the returns of S&P500 to STI, recent performance has been stellar.
While the difference may appear big at first glance, gap also narrows once you account for STI’s dividend yield, which has historically been around 3–4.5% a year.
The article did not take into account reinvested dividends
Conclusion
What started as a curious examination of the article seem to have output an interesting insight to Singapore stock market
The correlation of Singapore market to S&P500 From jan 2021 to jan 2025 has been a mere 0.440 and beta of 0.29
Which means for every 1% the S&P 500 has gone up or down, the STI has typically only moved about 0.29%.
Over the years, i've seen people spending a lot of time debating whether to invest in the S&P 500 or the STI.
Perhaps we’re asking the wrong question.
If the two markets behave differently, maybe the real benefit isn’t choosing one over the other, it’s owning both.
Diversification isn’t about buying different tickers.
It’s about owning assets that don’t move together.
Member discussion